
Pandas是一个非常强大的数据分析方面的Python package. 如果是做Machine Learning或者数据分析, 掌握Pandas很省去很多麻烦. 许多Machine Learning前期的数据处理也是用Pandas做得.
IBKR(Interactive Brokers, 有时简称IB, 中文叫盈透证券)是美国老牌券商, 也是我的主要使用的券商. 又到了辞旧迎新的时候, 需要看看2020投资收益, 于是趁新年长周末写点小程序做点数据分析. 而这正好覆盖了Pandas的各种常用functions.
下载IB Statement
IB Statement提供多种方式下载, 比如html, pdf, csv. 用作数据处理选csv. 内容大概长这样
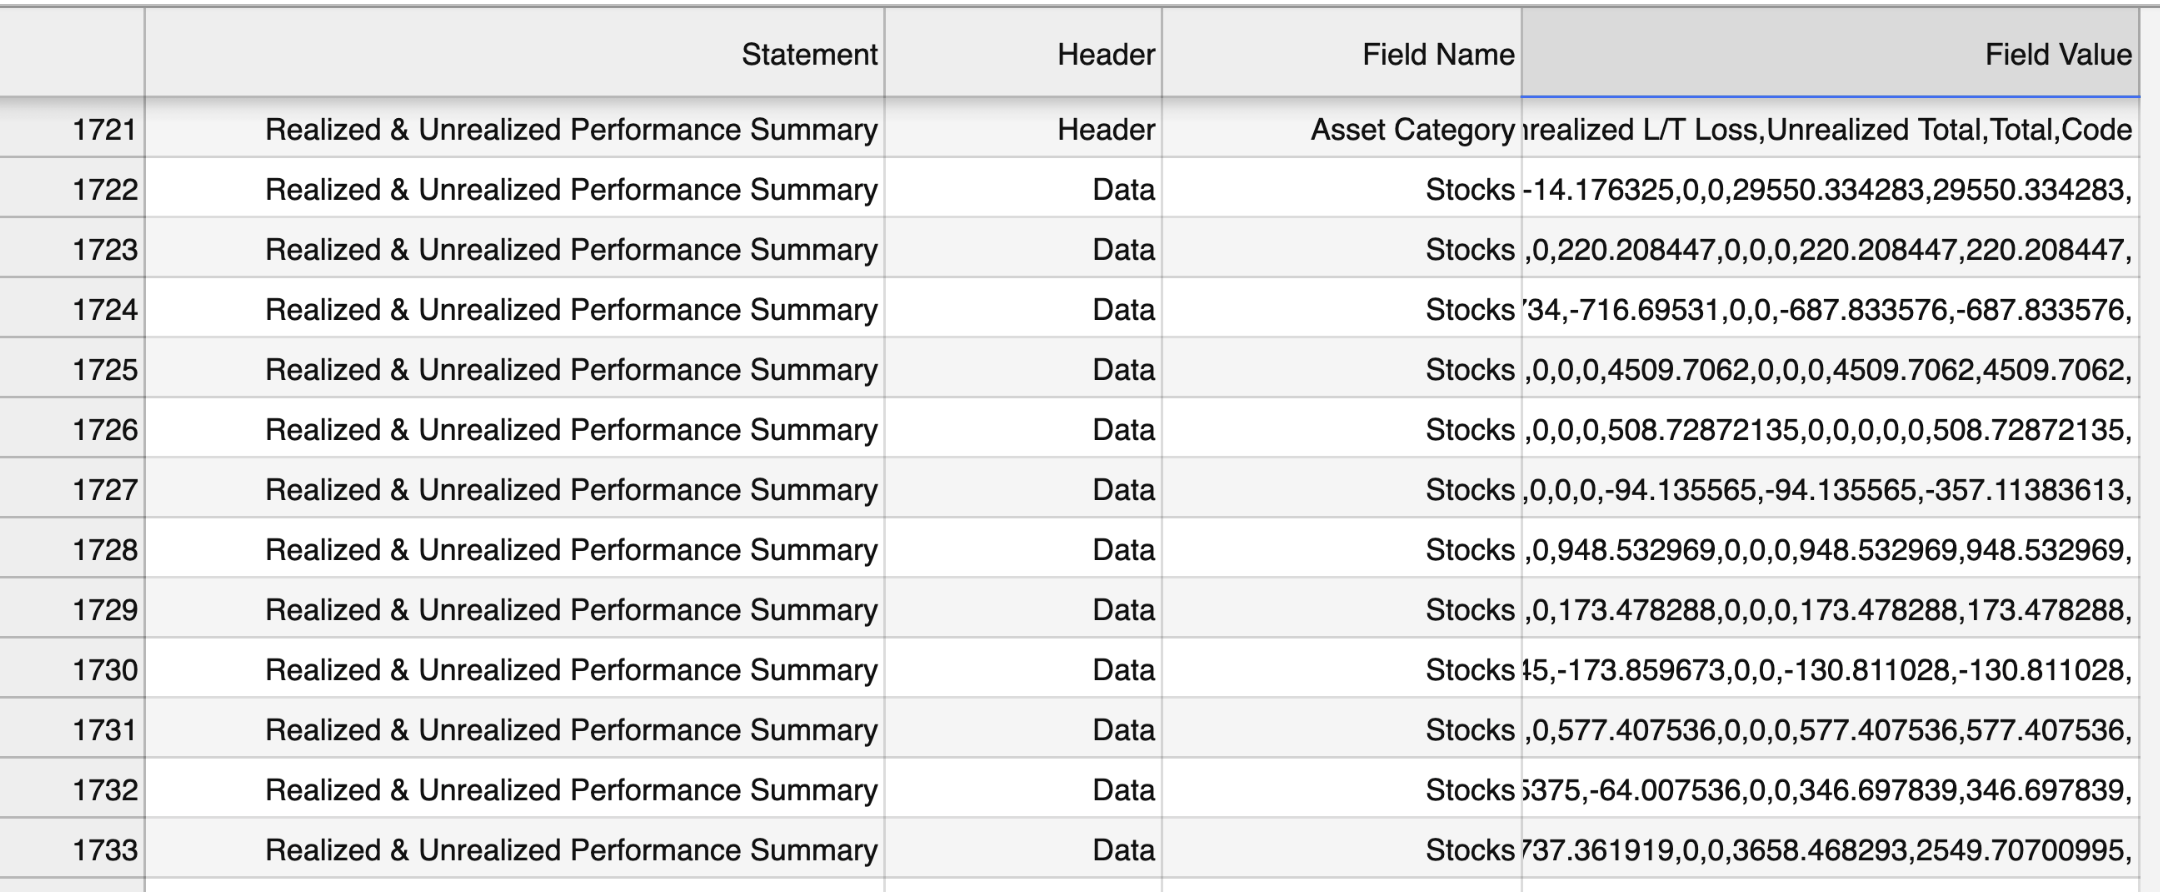
Statement这个column是内容, 里面有很多项, 而这里我只看“Realized & Unrealized Performance Summary”, 然后相同的第一列后面的列数都是一样的. 上图是Jupyter Lab的显示有问题. 因为文件其实可以看成很多CSV files连在一起, 而第一列可以看成是小csv的文件名. 然后第二列是Header或者Data. Header那行就是告诉你后面的Data行里每一列都是什么. 于是我们可以把数据读到内存里.
建立Pandas DataFrame
import pandas as pd

field = 'Realized & Unrealized Performance Summary'

f = open('statement.csv', 'r')

rows = []
for line in f:
    cols = line.strip().split(',')
    if cols[0] == field:
        if cols[1] == 'Header':
            header_row = cols[2:]
        else:
            rows.append(cols[2:])
header_ros是个list of string
['Asset Category',
 'Symbol',
 'Cost Adj.',
 'Realized S/T Profit',
 'Realized S/T Loss',
 'Realized L/T Profit',
 'Realized L/T Loss',
 'Realized Total',
 'Unrealized S/T Profit',
 'Unrealized S/T Loss',
 'Unrealized L/T Profit',
 'Unrealized L/T Loss',
 'Unrealized Total',
 'Total',
 'Code']
而rows是list of list. 就是list of rows
[['Stocks',
  'AAPL',
  '0',
  '0',
  '0',
  '0',
  '0',
  '0',
  '29564.510608',
  '-14.176325',
  '0',
  '0',
  '29550.334283',
  '29550.334283',
  '\n'],
 ['Stocks',
  'AMD',
  '0',
  '0',
  '0',
  '0',
  '0',
  '0',
  '220.208447',
  '0',
  '0',
  '0',
  '220.208447',
  '220.208447',
  '\n'],
...
]
接下来就可以用Panda create dataframe了
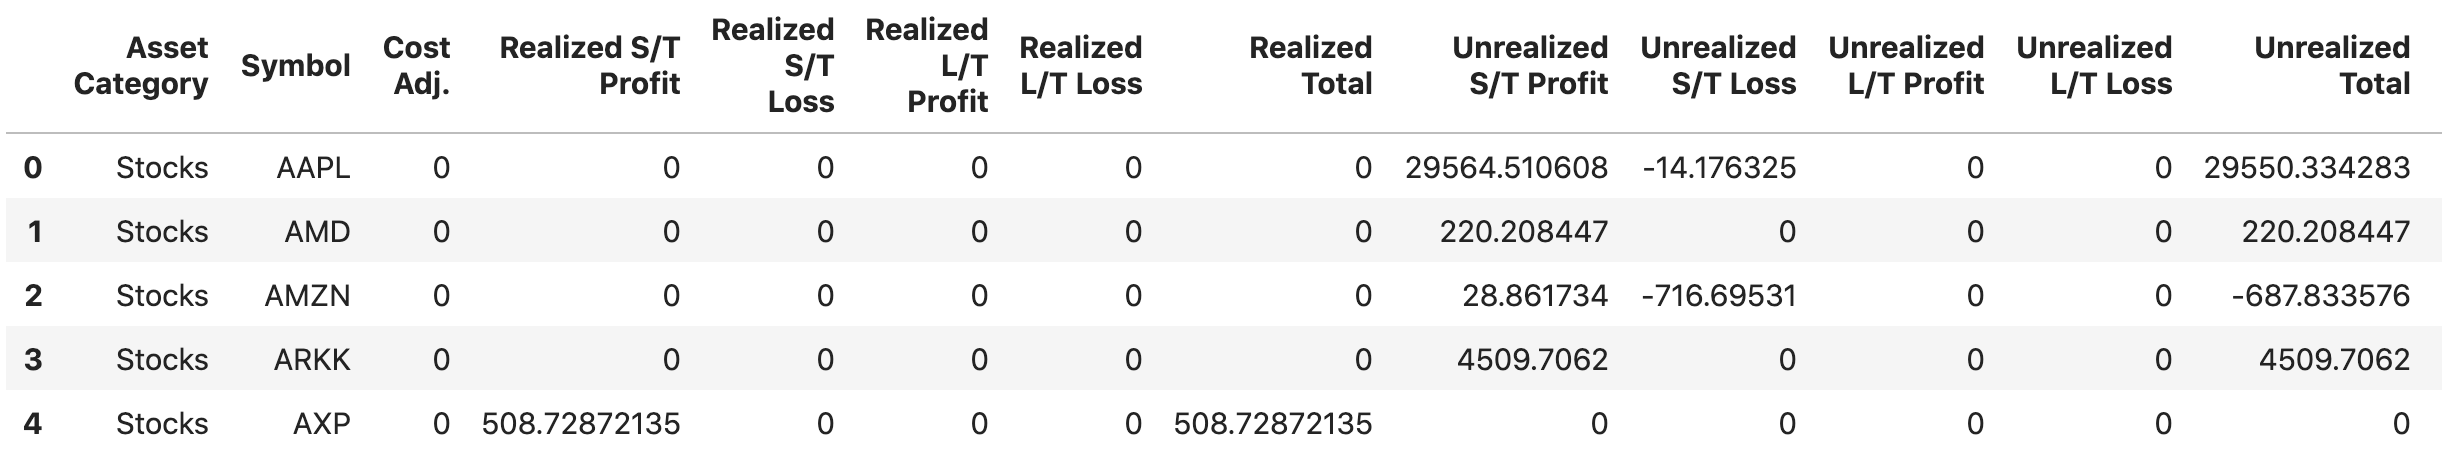
df = pd.DataFrame(rows, columns = header_row)
df.head(5)
这里有个问题. Created出来的dataframe的数据类型有数字有string, 全部都是object. 如果sort by数字column得到的结果是sort by string, 并不是我们想要的. 可以用dtypes来确定
df.dtypes
Asset Category           object
Symbol                   object
Cost Adj.                object
Realized S/T Profit      object
Realized S/T Loss        object
Realized L/T Profit      object
Realized L/T Loss        object
Realized Total           object
Unrealized S/T Profit    object
Unrealized S/T Loss      object
Unrealized L/T Profit    object
Unrealized L/T Loss      object
Unrealized Total         object
Total                    object
Code                     object
dtype: object
这里我把需要转换成数字的columns转换了
header_text_col = set(['Asset Category', 'Symbol', 'Code'])
num_col = list(set(header_row) - header_text_col)
df[num_col] = df[num_col].apply(pd.to_numeric)
df.dtypes
Asset Category            object
Symbol                    object
Cost Adj.                  int64
Realized S/T Profit      float64
Realized S/T Loss        float64
Realized L/T Profit        int64
Realized L/T Loss        float64
Realized Total           float64
Unrealized S/T Profit    float64
Unrealized S/T Loss      float64
Unrealized L/T Profit      int64
Unrealized L/T Loss      float64
Unrealized Total         float64
Total                    float64
Code                      object
dtype: object
这样就可以对数字类型的column进行排序了, 比如下面指令做2步操作
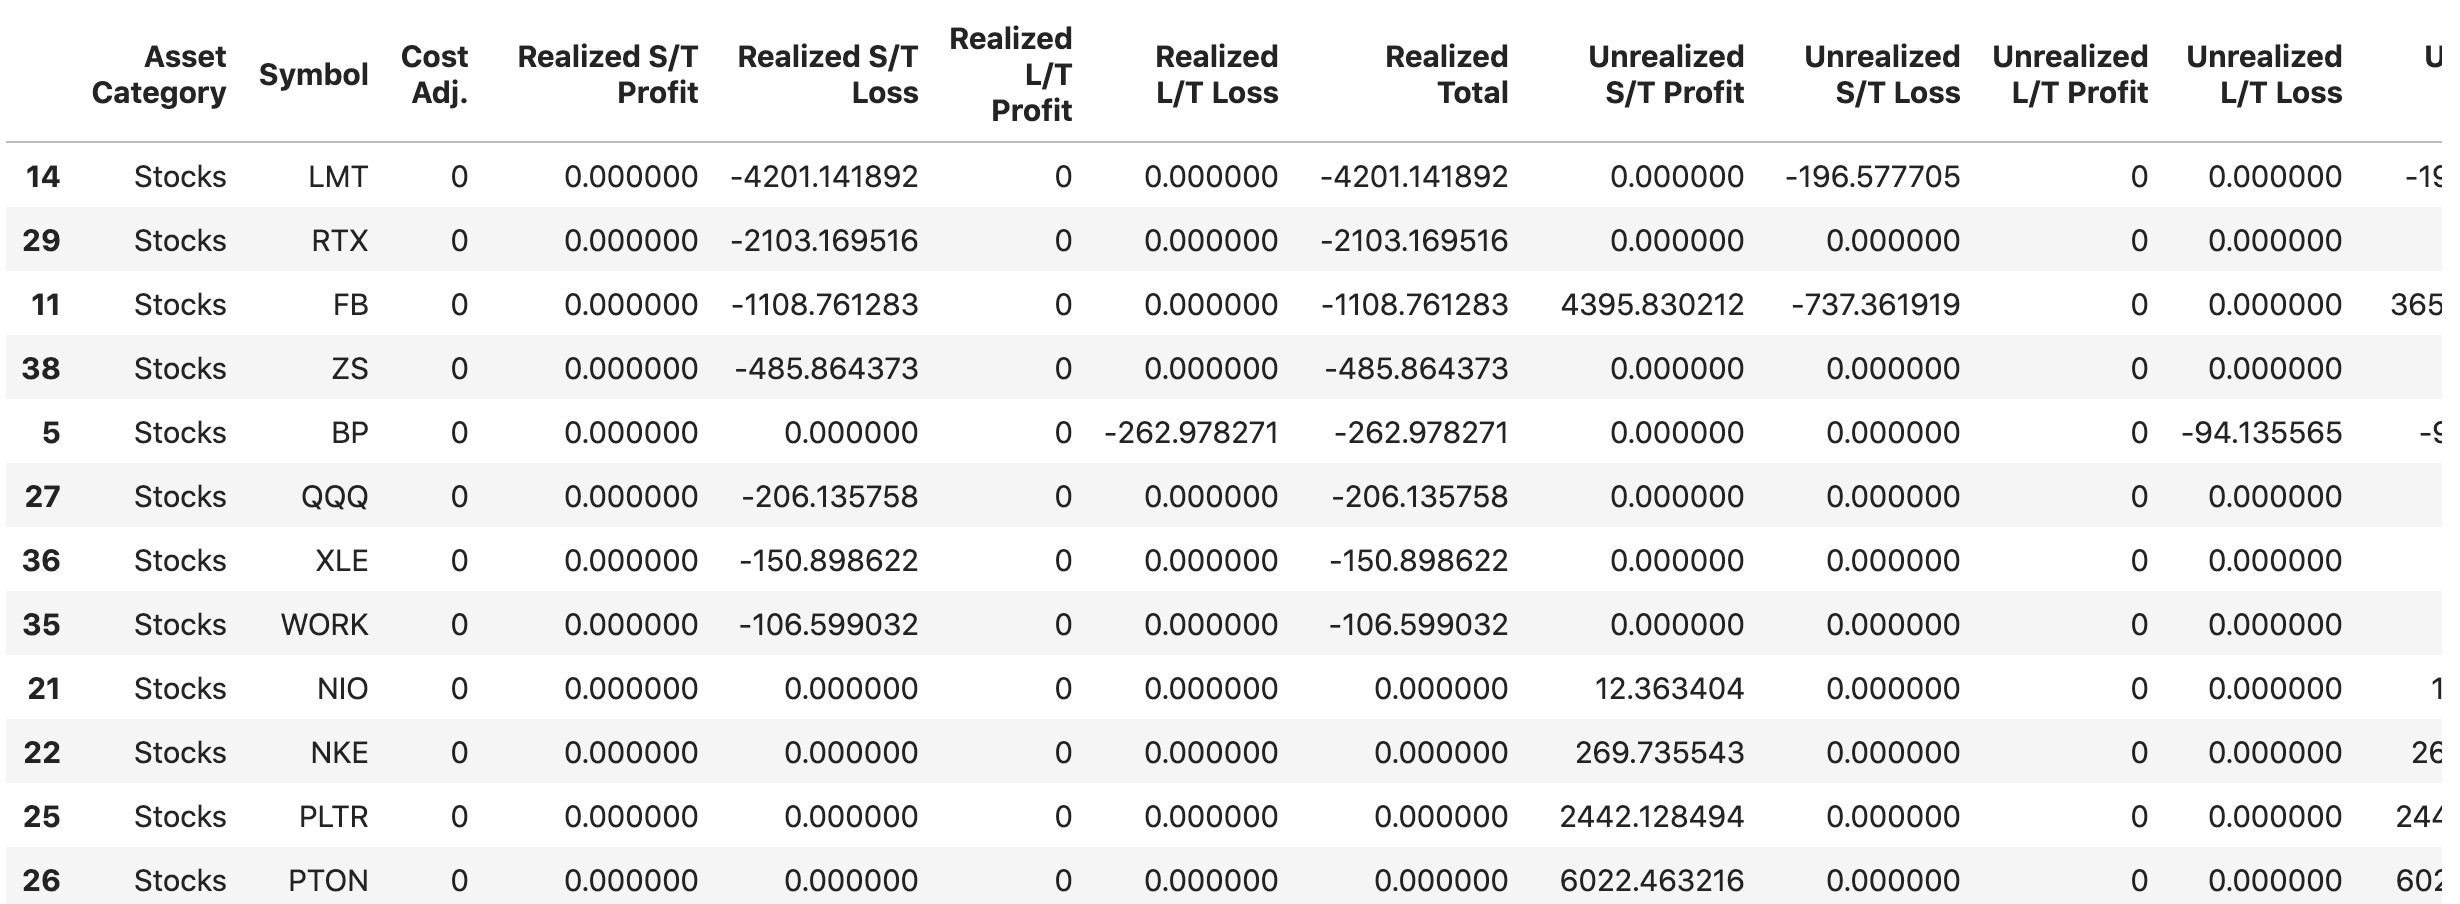
1. 选出Asset Category是”Stocks”的rows, 相当于SQL里的where, 语法为df[df['Asset Category'] == 'Stock'], return是另一个filtered好的dataframe
2. 按Realized Total从小到大排序, return也是另一排序好的dataframe
df[df['Asset Category'] == 'Stock'].sort_values(by=['Realized Total'], ascending=True)
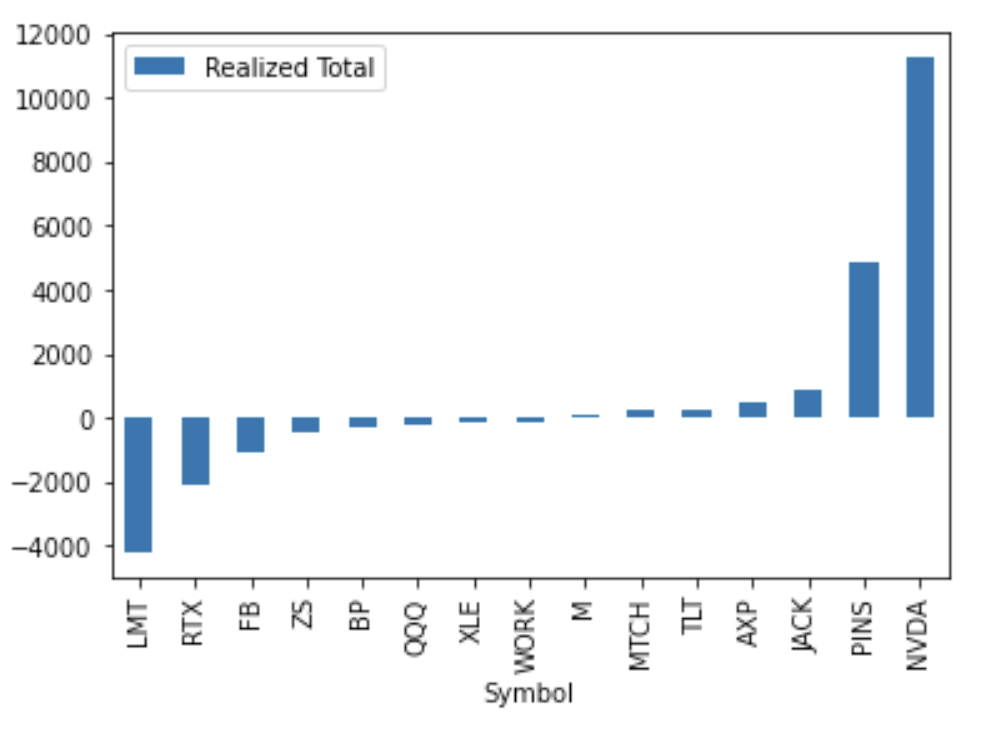
还可以画图
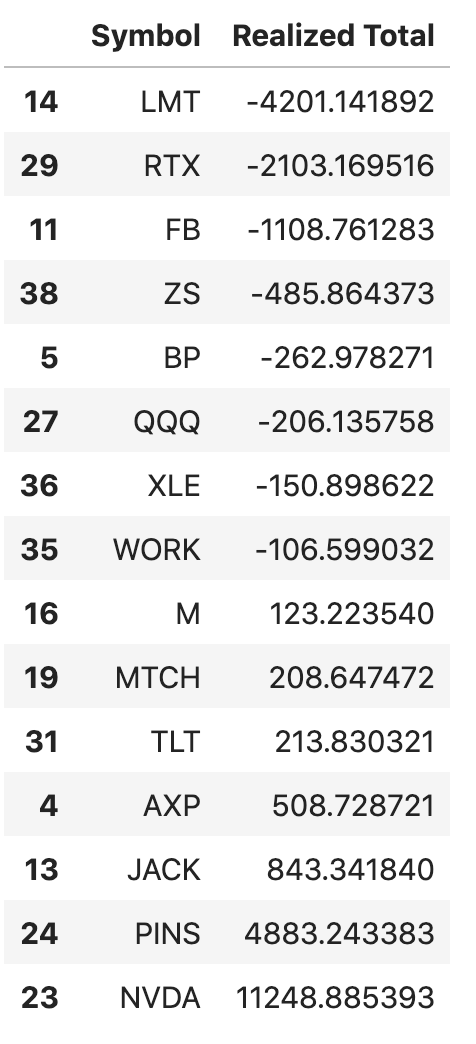
stock_gain = df[
    (df['Asset Category'] == 'Stocks') & (
        df['Realized Total'] != 0.0)][['Symbol', 'Realized Total']].sort_values(
    by=['Realized Total'], ascending=True)
stock_gain
还可以画图
stock_gain.plot.bar(x='Symbol')
技术小结
建立dataframe
rows是list of rows(lists), header_row是list of string
df = pd.DataFrame(rows, columns = header_row)
显示前n行
df.head(10)
显示后面n行
df.tail(10)
把特定columns转换成数字(numerical type)
num_col是list of strings, 下面命令会把num_col里的columns都转化成数字类. 类似SQL里的select cast(col1 as double), cast(col2 as double), ... from df
df[num_col] = df[num_col].apply(pd.to_numeric)
Filter和sort
类似SQL里, select * from df where asset_category = 'Stocks' order by realized_total asc;
df[df['Asset Category'] == 'Stocks'].sort_values(by=['Realized Total'], ascending=True)